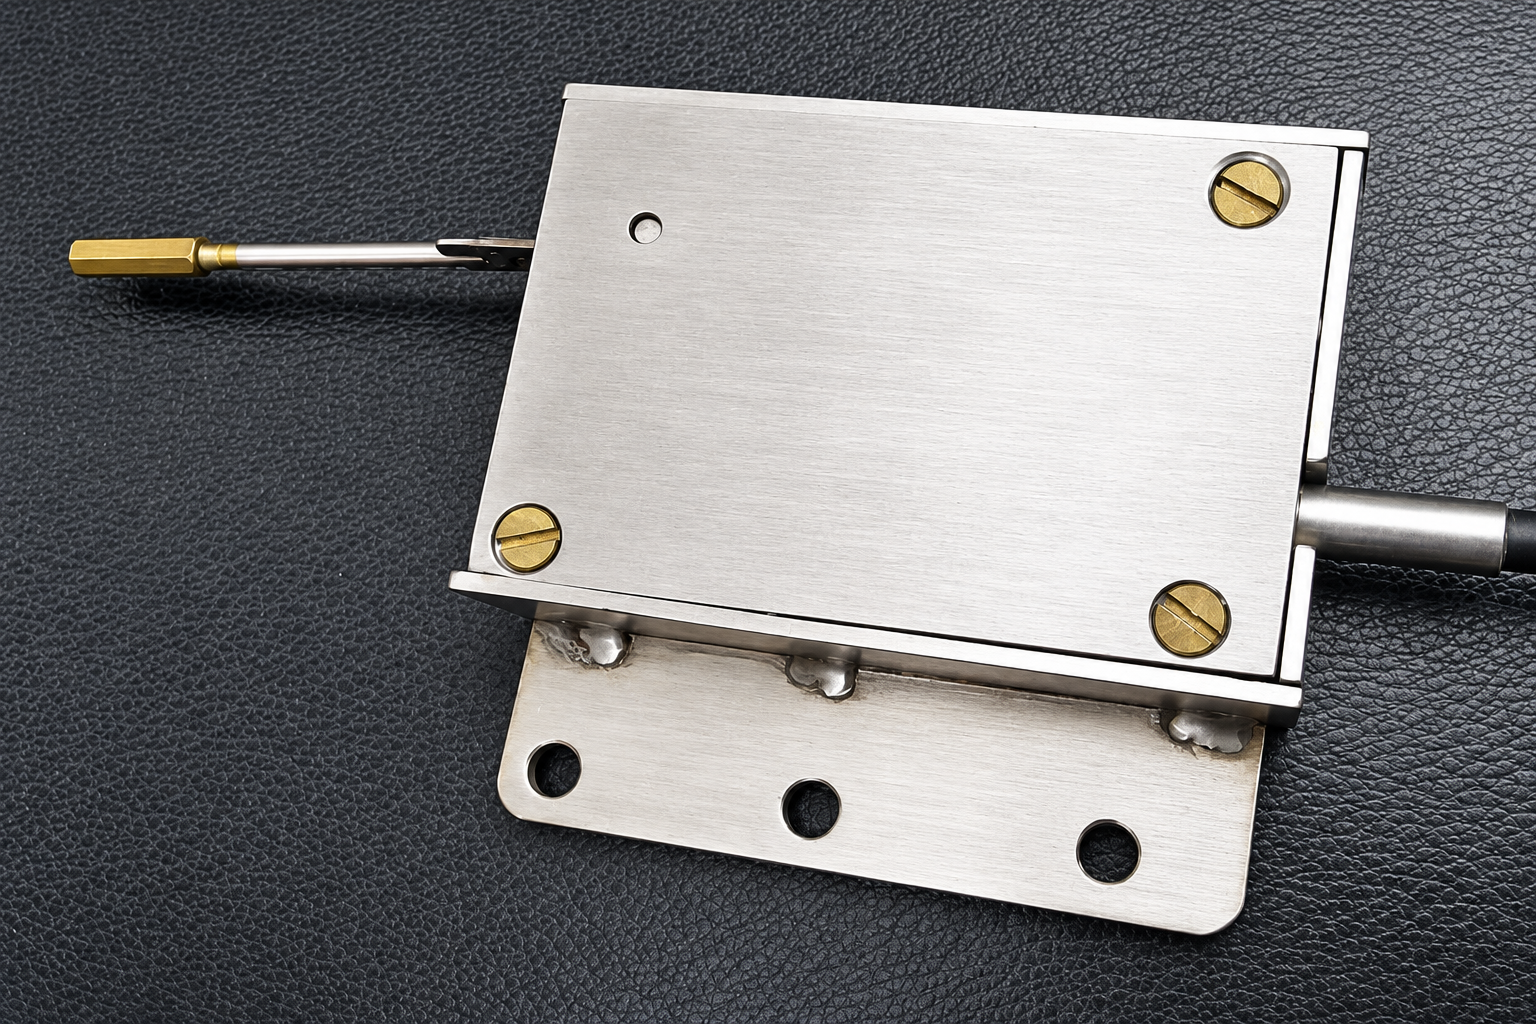
The EMCON Laboratory Wave Recorder (LOWR) is designed for simultaneous monitoring and recording of wave data from multiple sensors. Connected to a computer, the system captures real-time wave measurements, processes the acquired data and enables detailed analysis through Windows-based software.
System Components
This would be a particularly good section for this product because the brochure explains that the complete setup consists of multiple components.
- Laboratory Operated Wave Recorder: The electronic data-acquisition unit receives and records wave signals from multiple connected sensors and interfaces with the computer.
- Capacitance-Based Wave Sensors: Used to measure wave components at different positions within a wave tank or wave flume simultaneously.
- Additional Compatible Sensors: The system can also accommodate other measurement sensors, including run-up, tilt and heave sensors, depending on the experimental setup.
- Wave Acquisition Software: Windows-based data-acquisition software processes high-frequency wave data, converts measurements into the required units and presents wave characteristics for analysis.
Key Features
- Simultaneous multi-channel wave measurement
- Supports up to 32 sensors
- Real-time wave-data monitoring
- Live graphical display
- 27 Hz acquisition with capability up to 100 Hz
- Windows-based data acquisition and analysis
- Microsoft Excel data export
- RS232 / USB connectivity
- Compatible with multiple sensor types
- Designed for model tanks and wave flumes
Wave Parameters Processed
The software processes recorded wave data to derive parameters including:
- Wave Height
- Trough Height
- Crest Height
- Wave Period
- Trough-to-Trough
- Crest-to-Crest
- Zero Up Crossing
- Zero Down Crossing
Applications
- Laboratory wave tanks
- Wave flumes
- Hydrodynamic model studies
- Wave behaviour experiments
- Coastal and offshore engineering research
- Multi-point wave measurement
- Experimental wave-data acquisition
- Research requiring simultaneous sensor monitoring
Data Acquisition & Analysis
Wave data is captured and displayed in real time through the Windows-based acquisition software. The system can monitor individual channels graphically and process the recorded measurements into useful wave parameters.
Data can subsequently be exported to Microsoft Excel, allowing researchers to carry out further analysis and maintain experimental records.